
Your Rooftop Should Be Paying You
-
-
slice.mit.edu
Filed Under


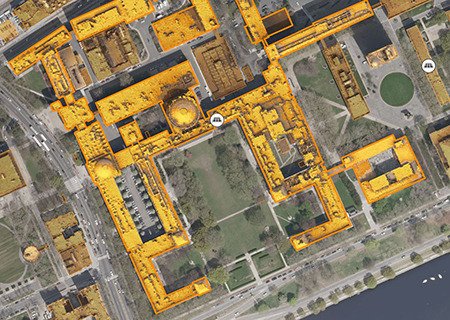
Mapdwell, founded by J. Alstan Jakubiec PhD ’14, MIT Associate Professor Cristoph Reinhart, and Eduardo Berlin, generates a map of your home’s rooftop with the personalized upfront costs, monthly savings, and reduced carbon footprint you can anticipate from a solar installation.
“One of the important things is it’s very specific to your rooftop,” said Jakubiec, the company’s CTO about the company’s Solar System software, which recently won a 2014 Fast Company Innovation by Design award in data visualization.
Using Mapdwell’s solar access slider, you can see how costs and benefits adjust based on the size of your solar panel. The software also suggests the best locations on your roof for a solar panel.
For example, if 10 percent of MIT’s original campus was covered in solar panels, Mapdwell reports that MIT would pay off the upfront panel costs of $3.1 million in eight years and receive $30,363 in monthly revenue.
The idea is based on CEO Eduardo Berlin’s vision of using city data to influence sustainability. While at MIT, the founders developed back-end calculations for Mapdwell and their research included three months of evaluating existing solar panels on top of MIT’s Student Center.
The City of Cambridge partnered with them, sharing city data and offering a software sandbox to test mapping calculations. Since launch, four additional US cities and one Chilean city have joined. And future sustainable maps are in the works.
Mapdwell is not the first solar mapping system on the market, but it rolls out some unique features.
The company uses a grid of rooftop sensors that channel data to its ray tracing models. Such models assess what the sun’s rays are doing at specific locations at any point in time during the day and year.
The model identifies where there is lower solar potential in shaded areas produced by trees and other buildings. It also accounts for different types of light and the reflections from neighboring buildings.
According to Alstan, Mapdwell’s mapping is truly three-dimensional. “Other geographic information system models don’t actually produce three dimensionality. They just produce two-dimensional graphics with heights represented as a third variable.”
Jakubiec thinks a personalized map of your own roof and your neighborhood could demystify solar adoption and make it more accessible. “It gets into the mindset of people. You can say look up, look at your city, not just at your rooftop but your neighbors,” he said.
Things may be looking up.


