
You Are Here: Urban Social-Computing Snapshots
-
-
slice.mit.edu
Filed Under


Maps reveal much more than geography. The MIT Media Lab’s Social Computing group is meshing data and design to produce a cascade of maps that humanize and personalize selected creative cities. They call each map an “atlas of experience.”
Their maps, produced though a project called You Are Here, target the kinds of detail that can matter in urban living. For example, you can find a map showing the fastest transportation mode in Chicago (and many other cities); the opening hours of businesses in Jackson, MS; or illnesses treated by hospitals in New York. Others identify the locations of coffee shops, rat sightings, or bicycle crashes in selected urban locations. The permanent visa application maps offer international snapshots of a cities—including industry categories by popularity. For example, IT work visas are most popular in Los Angeles.
The team is led by Associate Professor Sep Kamvar, an artist and entrepreneur who served as Google's head of personalization after his startup was acquired by the search giant. And the goal is to apply social computing to “create loosely coupled, decentralized social systems that foster healthier real-world environments for living, learning, and making at scale.”
Check out these You Are Here maps and explore others.
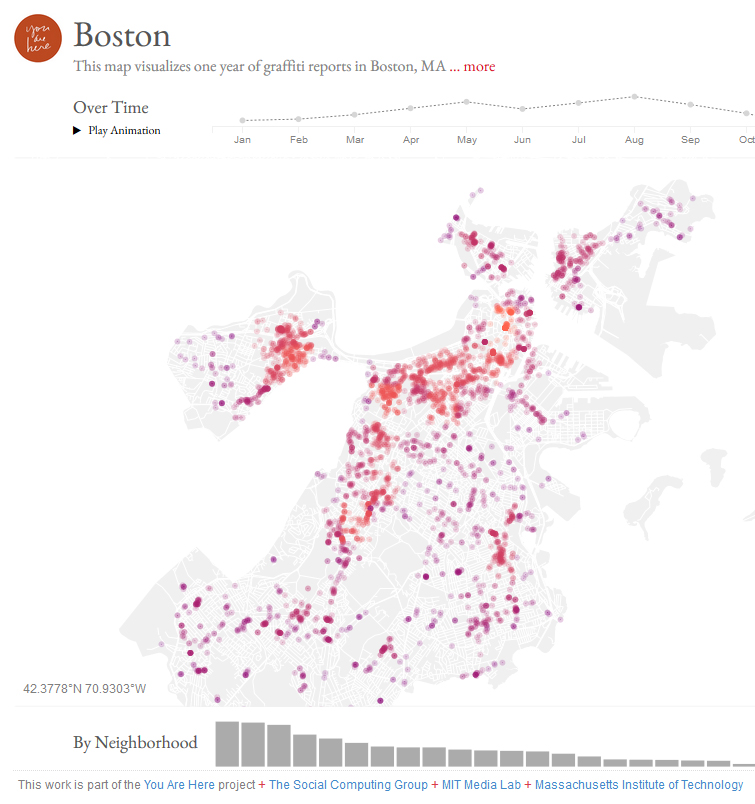
Boston: One year of graffiti reports
This map locates the hundreds of places that have been “scribbled, sprayed, painted, stenciled, tagged and noticed enough to be reported…We believe that seeing street art as a need rather than a nuisance, both for its viewers and its creators, could lead to more beautiful cities and a more empowered populace.”
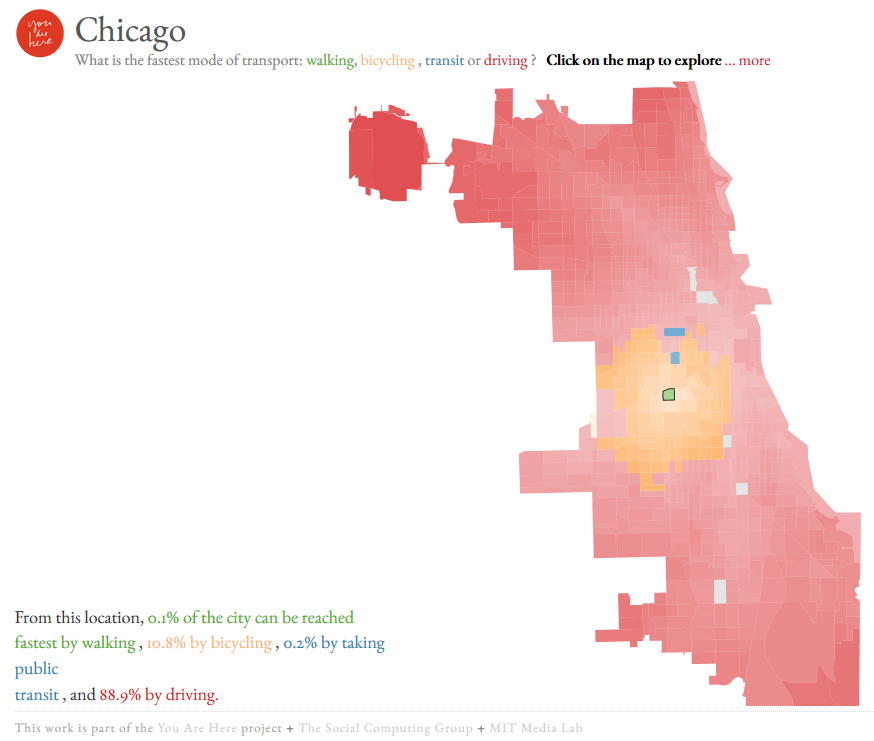
Chicago: What is the fastest mode of transport: walking, bicycling , transit, or driving ?
In this map, you pick a spot (say, X) and the map color codes the rest of the city indicating which transportation means would get you there fastest from X. As you mouse over different locations, you learn how many minutes it will take you to get there by the fastest means—walking, biking, public transit, or driving.
Want to know more? Learn about other Social Computing projects including the shopfront Wildflower Montessori School and a simple but powerful programming language called Dog.


