Making Data Digestible with Visuals
-
-
slice.mit.edu
Filed Under
Recommended

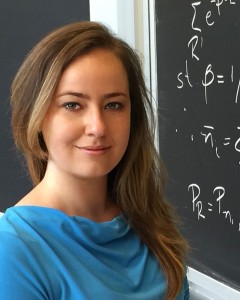
Over 90 percent of all of the data in the world was created in the last two years. It’s Angela Bassa’s job to figure out what that might mean. A 2003 graduate, Bassa is manager of the data science team at EnerNOC, a provider of cloud-based energy intelligence software (EIS). But long before her role at EnerNOC, Bassa was already deep in data. “I’ve always been using data to try and explain what is happening, why it’s happening, when it will happen again,” she says.
To offer their cloud-based service that helps to increase energy productivity, EnerNOC needs tons of data. Bassa and her team work to turn messy data about everything from weather to energy use into information that can be used by customers. “Our data is made up of weather models, consumption tracking, tariff structures, geographic nuances, regulations, and much more,” she explains. Once Bassa gets the vital information from mountains of data, she needs to share it with customers in a way that makes sense. That’s where data visualizations come in. “Visualization is a key component of communicating findings, and talented data scientists are well-versed in different methods of communicating and visualizing outcomes,” she says.

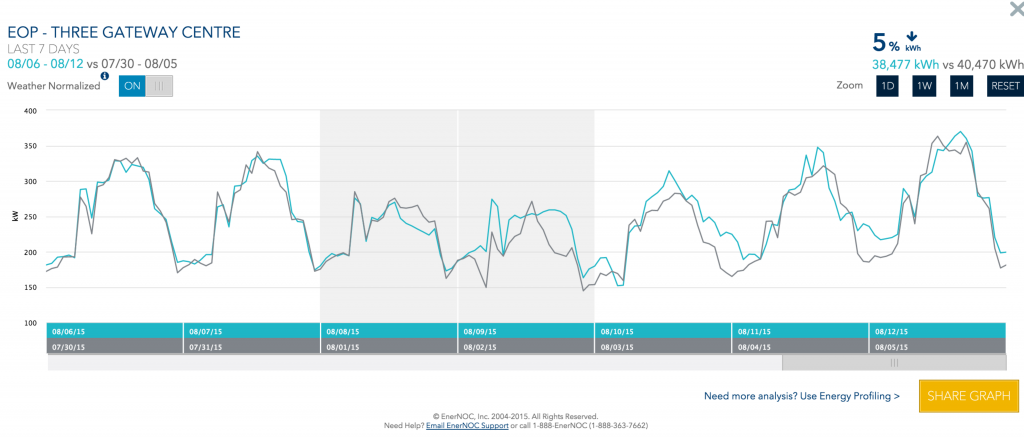
Bassa and her team use several tools to explain complex data in visual form. For example, when explaining a new weather normalization feature for their software that allows customers to see if facilities are using energy effectively no matter the weather, Bassa relied on graphs to share huge data sets with clients. “Communicating the complexity of weather impacts on energy consumption in a simple and intuitive visual is incredibly valuable,” she says. Clients can then see how weather affects energy consumption.
A Course 18 grad, Bassa was a natural fit for a data science role, but says that was never her plan. “I didn’t know what I wanted to be when I grew up,” she says. But Bassa always had an interest in math, science, and storytelling—the perfect mix for a would-be data scientist.
“I like to think of data science as a cross between three skills: math, computer science, and communications,” she says. The process of learning to break down problems in MIT courses also helped to ready Bassa for data science. “I’m sure grads from any course at MIT are well-prepared for a role in data science,” she explains. Bassa even has the data to prove that—MIT alumni make up the majority of her data science team.


