
Bad Choices: How Algorithms Can Help
-
-
slice.mit.edu
- 1
Filed Under


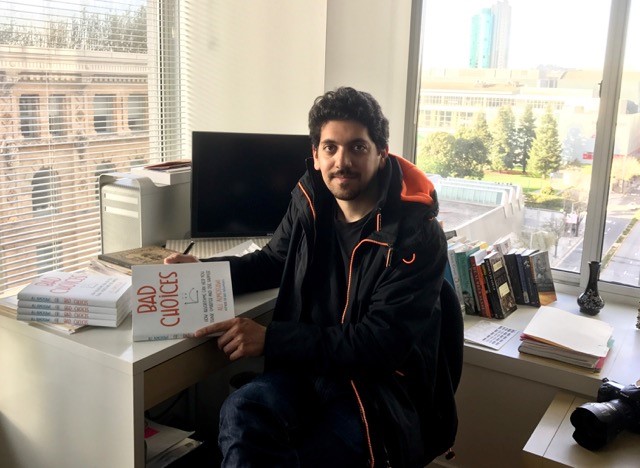
Faced with heaps of unmatched socks fresh from the dryer, how can you most efficiently sort them into pairs? In his new book, Bad Choices: How Algorithms Can Help You Think Smarter and Live Happier, Ali Almossawi SM ’12 ponders this and other common scenarios to show how to make better decisions.
“Computer scientists use several tools to evaluate algorithms. I was interested in seeing if we could use the same tools to evaluate everyday decisions that fit the definition of an algorithm,” he says.
Regarding the socks, Almossawi explains, “We can pick up a sock and then rummage through the pile for its pair. Alternatively, we can put each sock that we select to one side and only pair socks when we find a match. The second method is much faster when we have lots of socks. What’s primarily interesting isn’t the ability to just say how to best match socks, but the realization that thinking in terms of rates of growth and orders of magnitudes allows us to determine, consistently and in a disinterested way, why one of those methods is much more efficient than the other. And framing the book in terms of familiar scenes from everyday life serves as a compelling way to share concepts from computer science that have led to the innovations that we take for granted nowadays, like websites that recommend movies or restaurants to us and apps that help us get one place to another.”
Almossawi’s prior book, An Illustrated Book of Bad Arguments, has been translated into 18 languages. The charming illustrations in both books are by Alejandro Giraldo, based on Almossawi’s preliminary sketches.
Explaining topics using pictures and examples grew out of Almossawi’s multidisciplinary work at MIT. Shortly after he began graduate studies in what is now the MIT System Design & Management (SDM) program, a Sloan professor offered him a research assistantship that required doing data visualization. “I had no idea what that meant,” he recalls. “Essentially it’s taking data that’s not very accessible and turning it into something engaging and interesting to a particular audience.”
For example, he might design a graph to explain a specific concept. Among other things, he would consider “what kind of graph it should be, whether it should be interactive, what kind of story it should tell, and how to encode various dimensions of the data using color and position and so on.”
That work helped Almossawi develop his career path. In parallel with his studies, he had the opportunity to collaborate with a Media Lab group (then called Macro Connections) for six months, and then he was hired by the Firefox team at Mozilla to do data visualization full time. Now he works for Apple in the same field.
“MIT changed the way I thought about things. My cohort in the System Design and Management program came from different engineering backgrounds such as space, civil, mechanical, hardware, so the solutions to problems were always intriguing,” he says.
“The common thread in my projects at MIT, these books that I write on the side, and my work at Mozilla and Apple is turning something inaccessible into something that's compelling.”


Comments
Emil Friedman
Sun, 04/16/2017 2:14pm
Is your socks algorithm as follows?
Choose a sock and put it to the side.
Choose another sock. If it matches the first put them together. If not, put it next to the first.
Choose a third sock. Check it against the first two and put it next to them if it doesn't match either.
Etc.
Note that if you haven't matched any in the first "n" socks, the next sock will have to be checked against each of the n.