
Data Therapy: Making Numbers Tell Stories
-
-
slice.mit.edu
Filed Under


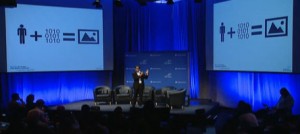
That's the goal of Rahul Bhargava SM '02, a research specialist at the Media Lab's Center for Civic Media. In his data therapy presentations, he walks audiences through some best practices for dynamic presentations that will tell a story with data.
For a quick overview, you can watch his five-minute video on creative ways to present data to community groups, a talk presented at the recent MIT-Knight Civic Media Conference on "The Story & the Algorithm."
If you go to Bhargava's Data Therapy blog, you will find lots more.
• Tool Evaluation Matrix—that helps groups decide if fusion tables or Google widgets, for example, might work best.
• Five Ws of Data Presentation—starting with defining the audience.
• A Prezi presentation—offered at a recent Hacks/Hackers Meetup.
For a deep dive, watch Bhargava's 90-minute Data Therapy Webinar on MIT TechTV. Topics include using goals and audience to select a data presentation technique; evaluating presentations; grabbing audience attention; and design tips.


