 https://alum.mit.edu/www/toms/glossaryframes.html
i.e.
https://alum.mit.edu/www/toms/images/t7-aloall.jpg
This web page explains the x and y axes on the diana correlation plots. I'll start off by explaining coordinate systems for DNA sequences.
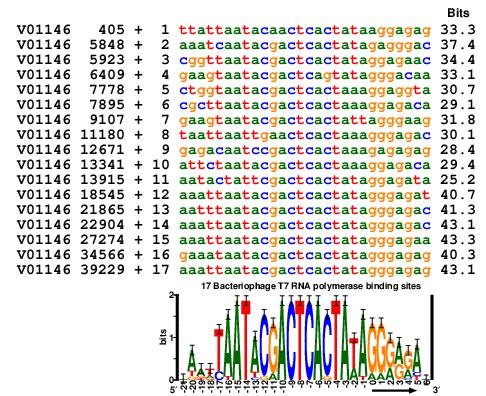
Here is an 'aligned listing' of all 17 bacteriophage T7 promoters:
                   ------------
                   221111111111--------- ++++++
                   1098765432109876543210123456
                   ............................ bits
 V01146   405 +  1 ttattaatacaactcactataaggagag 33.3
 V01146  5848 +  2 aaatcaatacgactcactatagagggac 37.4
 V01146  5923 +  3 cggttaatacgactcactataggagaac 34.4
 V01146  6409 +  4 gaagtaatacgactcagtatagggacaa 33.1
 V01146  7778 +  5 ctggtaatacgactcactaaaggaggta 30.7
 V01146  7895 +  6 cgcttaatacgactcactaaaggagaca 29.1
 V01146  9107 +  7 gaagtaatacgactcactattagggaag 31.8
 V01146 11180 +  8 taattaattgaactcactaaagggagac 30.1
 V01146 12671 +  9 gagacaatccgactcactaaagagagag 28.4
 V01146 13341 + 10 attctaatacgactcactaaaggagaca 29.4
 V01146 13915 + 11 aatactattcgactcactataggagata 25.2
 V01146 18545 + 12 aaattaatacgactcactatagggagat 40.7
 V01146 21865 + 13 aatttaatacgactcactatagggagac 41.3
 V01146 22904 + 14 aaattaatacgactcactatagggagac 43.1
 V01146 27274 + 15 aaattaatacgactcactatagggagaa 43.3
 V01146 34566 + 16 gaaataatacgactcactatagggagag 40.3
 V01146 39229 + 17 aaattaatacgactcactatagggagag 43.1
On the top are 3 lines I call a 'numbar' - a 'number bar'. Reading
vertically you will see on the left -21 and on the right +6. In other
words, the numbar just numbers columns. Its advantage is that you can
directly read the number for every column.
Below the dotted line are data and the sequences. On the left is the GenBank Accession number followed by the coordinate of the first base of the transcript. Then the '+' means the sequence that follows is oriented in the same direction as the GenBank entry. Following that is the number of the sequence, the sequence itself and the individual information of the sequence.
You can see that there is a 'zero base' in the numbar. This 'zero coordinate' corresponds to the first base of the transcript made by the T7 RNA polymerase.
So there are two coordinate systems here. The first, 'absolute coordinates', are those in the second column. They represent GenBank locations.
The other coordiante system, 'relative coordinates' is the bases relative to the GenBank start of each transcript. So we can talk about the first base of the transcript (relative coordinate zero), one base downstream (relative coordinate 1) etc.
Sequence logos and sequence walkers are created from aligned sequences (as above) and so they use the relative coordinate system. The logo for this set of sequences is shown in the figure near the top of my glossary:
https://alum.mit.edu/www/toms/glossaryframes.html
i.e.
https://alum.mit.edu/www/toms/images/t7-aloall.jpg
(For simplicity I removed the numbar from that figure.)
Ok, that's absolute and relative coordinate systems.
The diana program
https://alum.mit.edu/www/toms/delila/diana.html
uses the relative coordinates to look at correlations between positions around the zero coordinate.
'Diana' stands for 'dinucleotide analysis'.
Consider some position relative to the zero coordinate, x. In the aligned sequences above, this x may be anywhere in the range from -21 to +6. This is the axis of the sequence logo.
Now consider a second position relative to the zero coordinate, y.
We can ask whether the base at x is correlated or not to that at y. This is what diana computes. The original paper is:
@article{Stephens.Schneider-splice1992,
author = "R. M. Stephens
  and T. D. Schneider",
title = "Features of spliceosome evolution and function
inferred from an analysis of the information at human splice sites",
journal = "J. Mol. Biol.",
volume = "228",
pages = "1124--1136",
note = "\htmladdnormallink
{https://alum.mit.edu/www/toms/papers/splice/}
{https://alum.mit.edu/www/toms/papers/splice/}",
pmid = "1474582",
year = "1992"}
Consider the column of bases at position x. There are 4 possible
bases. Consider a different column y which will also have 4 possible
bases. Now consider the possible pairs of bases at x and y on each
sequence. There are 4x4 = 16 possible pairs within one sequence when
comparing position x to position y::
AA AC AG ... TT
So for any pair of positions, x and y, around the zero coordinate we get 16 numbers in a 4x4 table.
From these numbers we can compute the correlation. Instead of a correlation coefficient, we express the result in bits. (Details are in the paper.)
So we can make a graph of x versus y and for such each pair we show the correlation (in bits) as a colored square.
Of course x and y cover the whole range and so x=5 y=10 gives the same correlation as x=10, y=5. To save computation time, the diana program only shows data for x=y or x>y.
In our paper:
@article{Bindewald.Shapiro2006,
author = "E. Bindewald
and T. D. Schneider
and B. A. Shapiro",
title = "{CorreLogo: An online server for 3D sequence logos of RNA and
DNA alignments}",
journal = "Nucleic Acids Res.",
volume = "34",
pages = "w405-w411",
pmid = "16845037",
year = "2006"}
https://alum.mit.edu/www/toms/papers/correlogo/
we showed these correlations as vertical stack and so generated 3D seuqence logos. In the correlogo both are shown and that's why the image is symmetrical along the diagonal.
![]()

Schneider Lab
origin: 2013 Apr 10
updated: 2013 Apr 10
![]()