{ version = 1.48; (* of sphere.p 2014 Dec 06}
(* begin module describe.sphere *)
(*
name
sphere: plot density of Shannon spheres
synopsis
sphere(spherep: in, sigma: out, xyin: out, output:out)
files
spherep: parameters.
The first line is the step size interval (0.01 works well).
the second line is the maximum radius to calculate out to (= maxr,
3.1 works well).
Each following line is a dimension to plot.
If the dimension number is negative, it must be followed on the same line
by the coordinates of the position to place the dimension numeral.
The absolute value of the dimension is used in the calculation.
If the dimension is negative AND not an integer, the coordinates of the
position must be followed by the number of decimal places to display
the dimension.
sigma: lists the estimates for Rmaximum +/- sigma,
taken as the radius when the curve passes through exp(-1/2).
xyin: input to xylop, the plot
output: messages to the user
description
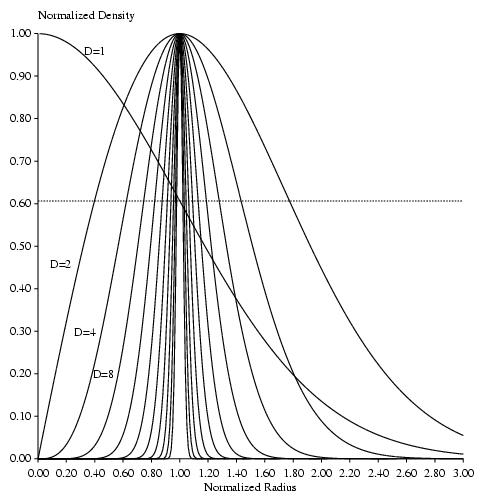
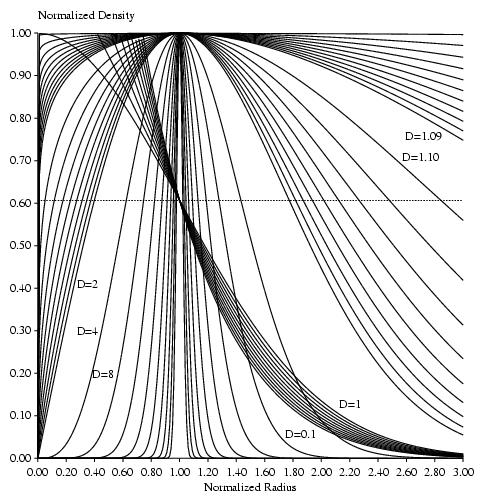
Create a graph of radius versus density of Shannon spheres
at various given dimensions. The output is run through xyplo.
The function is:
pd(R) = R^(D-1) * exp(-R^2/(2* sigma^2))
where '^' means to exponentiate and
where sigma^2 * (D-1) - Rmaximum^2
so setting Rmaximum = 1 relates sigma and D.
The graph is in the range (0,0) to (r=maxr,1)).
The curve is normalized so that its maximum is at (1,1).
(except when dimension = 1, where it is at (1,0).
Since xyplo can't plot several separate curves, without being
told each symbol, this program simply starts at (0,pd(r)), draws
the curve to (maxr,pd(maxr)), then circles back by drawing lines
to the x axis (2*maxr,0) and then the origin (0,0). By setting
the region that xyplo plots below maxr, one gets nice, fully
correct curves that do not appear to be connected.
documentation
[1988 jan 23,5]
@article{Schneider.ccmm,
author = "T. D. Schneider",
title = "Theory of Molecular Machines.
{I. Channel} Capacity of Molecular Machines",
journal = "J. Theor. Biol.",
volume = "148",
thenumber = "1",
pages = "83-123",
comment = "{(Note: The figures were printed out of order!
Fig. 1 is on p. 97)}",
note = "\htmladdnormallink
{https://alum.mit.edu/www/toms/papers/ccmm/}
{https://alum.mit.edu/www/toms/papers/ccmm/}",
year = 1991}
see also
Schneider.ccmm paper:
https://alum.mit.edu/www/toms/paper/ccmm
example parameters: spherep
example plotting file for xyplo: sphere.xyplop
plotting program: xyplo.p
resulting graph, postscript ... : sphereinteger.ps
resulting graph, jpg .......... :
 example of fractal graph parameters: spherep.fractal
resulting graph, postscript ... : spherefractal.ps
resulting graph, jpg .......... :
example of fractal graph parameters: spherep.fractal
resulting graph, postscript ... : spherefractal.ps
resulting graph, jpg .......... :
 Related programs:
compress D dimensional sphere to 2D: ... ring.p
plot output of ring: ................... riden.p
Match fdr curve: ....................... fdr.p
author
Thomas Dana Schneider
bugs
none known
*)
(* end module describe.sphere *)
{This manual page was created by makman 1.45}
Related programs:
compress D dimensional sphere to 2D: ... ring.p
plot output of ring: ................... riden.p
Match fdr curve: ....................... fdr.p
author
Thomas Dana Schneider
bugs
none known
*)
(* end module describe.sphere *)
{This manual page was created by makman 1.45}
{