Comparison of 18 and 32 site OxyR models

9 OxyR binding sites and their complements

16 OxyR binding sites and their complements

This compares the OxyR models
(18 and 32 sites)
by
Pete Lemkin's flicker method.
Unfortunately the right part gets cut off by the program that converts from
postscript to gif, but fortunately it is redundant with the left edge.
The flicker shows that there is no major change, but rather little changes
throughout the model, as one might expect. Note how the error bar at
position +7 changes with the number of sites in the model. (Other
positions change too, but they also shift, making it hard to see the effect.)
The information content increased:
18: Rs total is 17.26125 +/- 0.83500 bits in the range from -30 to 30
32: Rs total is 18.55380 +/- 0.44600 bits in the range from -30 to 30
(Note: total error is larger, this is only sampling error.)
Histogram information.
The SEM is error for logos, so the difference above is not significant.
The slight differences are because the logo was evaluated -30 to +30
while the ri was computed from -20 to +20.
*         18  numbers are in the file
*   11.18831  is the minimum number
*   26.00354  is the maximum number
*   17.49575  is the MEAN
*    4.37847  is the STANDARD DEVIATION
*    1.06194  is the STANDARD ERROR OF THE MEAN (SEM)
*   19.17100  is the variance
*    2.64160  is the uncertainty in bits
*    4.17752  is the computed uncertainty in bits (Shannon p.57)
*         32  numbers are in the file
*    7.35348  is the minimum number
*   29.31905  is the maximum number
*   18.38069  is the MEAN
*    6.02539  is the STANDARD DEVIATION
*    1.08219  is the STANDARD ERROR OF THE MEAN (SEM)
*   36.30531  is the variance
*    3.57782  is the uncertainty in bits
*    4.63815  is the computed uncertainty in bits (Shannon p.57)

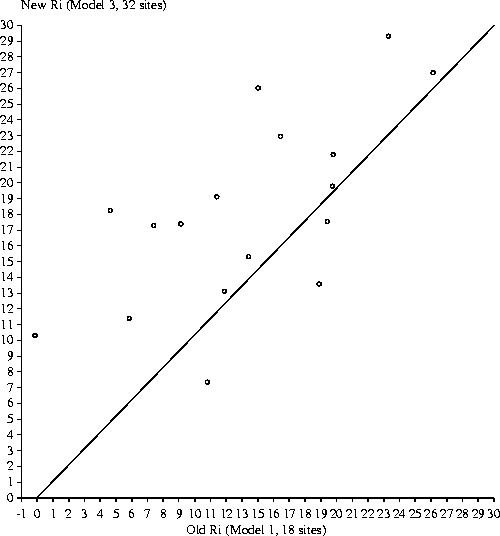
This compares the OxyR models
(list for first model (18) sites
and
list for third model (32) sites
)
by
graphing the
individual information of each site based on each model.
Note how most points fall above the regression line; this indicates that the
new Ri is higher than the old Ri, which is to be expected.
The points are also very scattered, as a result of the difference in the
model components. One site was removed in the process of upgrading from
Model 1 to Model 3 (mu mom 2), and eight new sites were added
(hemH, dsbG,
fur, sufA, flu, trxC, fhuF.1, and fhuF.2).
See
the Ri paper,
especially
Figure 4.
The diffribl program shows that the most significant change in the ribl
matrices was at
positions 15,
which went up by as much as 13.5 bits (measuring
distance in Euclidean space of the weight matrix values).
Positions 13, 12, and 5 also showed increases of more than four bits.
ribl.1
ribl.3
The posdiff.13 file shows all differences.
From the comparison of the matrices,
ribl.compare.13,
we can see that these are small sample effects.
Overall conclusion:
The 9 site model
(Schneider1996),
was compared to the 16 site model used in this
paper. The model varies slightly as expected given the small sample of
sequences
(Schneider1997).
The sequence logos
(Schneider & Stephens 1990)
for the two models were compared by rapidly
switching between them (flickering,
Lemkin P.F.,
Electrophoresis 1997 Mar-Apr;18(3-4):461-70
Comparing two-dimensional electrophoretic gel
images across the Internet)
and only minor changes were noted.
The information contained between coordinates 4 and 7 increases in Model 3,
while the portions between coordinates 1 and 3 and coordinates 13 and 15
decreases.
Each individual site was evaluated by both models and for sites that were in both
models, the largest differences are increases of 6.97 (at O16) and 2.35 bits
(at ahpC) and a decrease of 3.83 bits (at gorA).
Otherwise, no site changed more than about 2 bits. As expected for models
built from small samples of sequences
(Schneider1997),
the new sites
were evaluated higher by the new model:
-
hemH increased from -0.1 to 10.3 bits
-
dsbG increased from 23.1 to 29.3 bits
-
fur increased from 14.5 to 26.0 bits
-
sufA increased from 9.5 to 17.4 bits
-
flu increased from 7.7 to 17.3 bits
-
trxC increased from 6.1 to 11.4 bits
-
fhuF.1 increased from 4.8 to 18.3 bits
-
fhuF.2 increased from 11.8 to 19.1 bits
The individual information weight matrices were compared using the
diffribl program
and were found to differ
only slightly from small sample effects.


Schneider Lab
origin: 2001 June 1
updated: 2001 June 11


