An Evaluation of "Ev" (PDF) (June 30, 2003 at ISCID, International Society for Complexity, Information, and Design) by I. G. D. Strachan critiques the Ev paper and program. This page is written to examine Strachan's claims. Apparently, the author is Ian Strachan, a Research Postgraduate Student at the University of Edinburgh School of Informatics.
'An Evaluation of "Ev"' claims that the Ev model fails on three points. These points will be examined based on the material of the introduction to the paper. This is not a thorough review of the entire paper.
First Claim:
The information that is supposed to arise "from scratch" without any external intervention, is in fact put into the simulation from the start. In order to be able to locate the binding sites, their locations have to be specified before the simulation can run. What follows during the simulation is simply a form of Supervised Learning, of a simple type of neural network (called a Perceptron).A careful examination of any Ev run shows that the information in the binding sites, Rsequence, is roughly zero when the program starts (Figure 2b, green curve). It is this information, which represents the information in the genetic material of an organism, that arises from scratch. Clearly it starts out low and increases, which is the meaning of "arises from scratch". As can also be seen from the figure (dashed line), the other information measure, Rfrequency, is a constant, exactly 4 bits in the simulation. In nature, Rfrequency is approximately constant because it is computed from the genome size and number of binding sites that are advantageous to have to control the genetic material. Both of these numbers are fixed on a long time scale. Although Rfrequency is set for any given simulation, in general it it may take on any value, so long as the simulation is not taxed in unreasonable ways, such as overcrowding the genome with binding sites. It is generally observed that Rsequence evolves toward Rfrequency as long as the parameters of the simulation are within reasonable values such as making the site width so sufficiently large that the sites can have more than Rfrequency bits of information and the mutation rates are low enough not to destroy all patterns. Finally, it should be noted that Rfrequency represents the environment of the genetic system. Obviously this must be simulated in the model. So, just as in the Ev program, genetic systems in nature do a "Supervised Learning" to match the environmental constraints. This is, of course, exactly what Darwin predicted. Thus, Rfrequency was the wrong measure to be objecting to, it is a constant. Strachan's error is to miss that the simulation matches the natural situation. The environment exists before evolution begins.
Second Claim:
The calculation of the information content for the binding sites is done in the paper by computing the information content at each of the six locations in the binding site separately, using all 16 sites as a sample, and then summing them. This relies on an important simplifying assumption that the values of the bases at each of the locations are statistically independent. This assumption is acknowledged in [Schneider et al., 1986], where the exact formulae for the information calculations are given, but it appears that in the current paper, the assumption is taken for granted. However, it can be easily demonstrated that this assumption does not apply in general for the simple perceptron recognizer used in the simulation.Clearly there are constraints on the weight matricies which make them non-independent since the values have to sum to a positive number for binding sites. That's only one degree of freedom removed for 3L+1 = 19 degrees of freedom in sites L=6 bases wide. This is only relevant to the computation of Rsequence. It does not affect the observed result, as seen from the sequence logos, that information appears in the binding sites during the course of many generations, and that this represents the gain of information during evolution.
Third Claim:
Further to this, we find that the actual formula for computing Rsequence(L), the information content for one location L in the site, is also flawed, relying on a standard formula for statistical entropy, or uncertainty, which itself can be derived only as an asymptotic limit as the number of samples tends to infinity, after applying Stirling's approximation for ln(N!). It can be demonstrated that this approximation is invalid for the small sample sizes (N = 16) that are used in the simulation.First, Shannon (Bell System Tech. J., 27, 379-423, 623-656, 1948) obtained the uncertainty by noting that it satisfies several properties that he desired. It is true that his formula can be derived in the limit from Stirling's approximation, but that is not necessary. That Stirling's approximation is not valid for small N does not indicate whether the measure computed directly is reasonable.
It appears that this claim neglects to account for the small sample error correction, which was used in the Ev simulation. (Note: I have not gone through the paper in enough detail to know for sure.) Of course the results are quite noisy when γ = 16. (Note on terminology: γ is the number of binding sites in the genome. N is the number of sites in a particular sample. In these simulations, γ = N, but generally in experimental molecular biology not all sites are known, because of resource limits, so γ > N.) If desired, a simulation with a large number of sites can be made, and our experience with these is that the evolved Rsequence is often near to Rfrequency. As with the second claim, even if the measurement is noisy and inexact, it is clear that information was gained in the binding sites of the organisms.
Below are some other notes about the paper compiled before the full evaluation is completed.
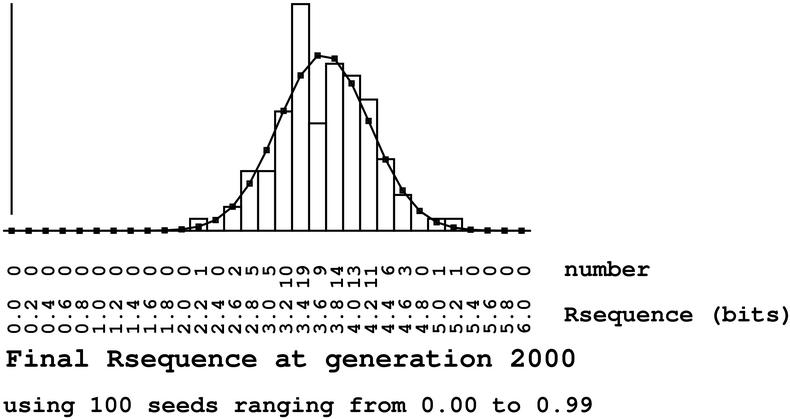
Figure 9: This figure shows a simulation in which Rsequence is approximately 3 bits but Rfrequency is 4 bits. Comparing this to the evend analysis we can see that one can get different results depending on the parameters. The question is whether the parameters were reasonable. Note that if Rsequence is significantly different from Rfrequency, then this tells one that there is something unusual going on in the binding sites from which we may learn new biology [Schneider et al., 1986]. Thus these two measures form a useful tool for biologists to understand the quantitative properties of genetic control systems. See the papers at this web site for examples.
Strachan's paper appears on an intelligent design web site rather than in the standard scientific literature. It would seem, therefore, that Strachan's goal is to demonstrate that biological information gain does not occur. Oddly enough, the paper shows clearly in Figure 9 that information is in the binding sites after the evolutionary cyclic process has been performed. Thus even Strachan's results show that there is information gain in the simulation, though we may disagree about the extent or exactly how it ought to be best measured. Since the Ev simulation corresponds point-for-point to the natural situation, the Ev model shows how information can be gained in binding sites in nature by mutation and natural selection.
I thank I.G.D. Strachan for pointing out a bug in the ev code (Appendix B). I also thank Michael Y. Levashov for confirming that bug. (The bug will be corrected when I have confirmed it for myself.)
![]()

Schneider Lab
origin: 2004 Sep 18
updated: 2011 Aug 17
![]()