Supporting information (online component) for
"The world's user-generated road map is more than 80% complete"
Chris Barrington-Leigh and Adam Millard-Ball
PLOS One, 2017
PLOS One study and Supporting information |
- The main article (our version) or the open version from PLOS One
- The 75-page Supporting Information (SI) as PDF
Data release: |
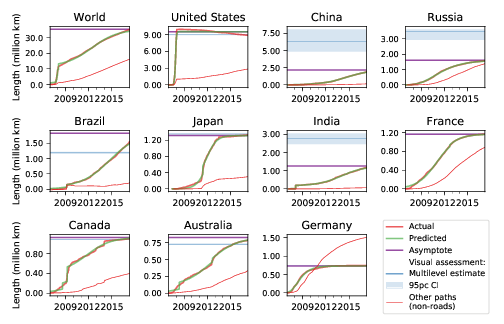
We provide both the data set corresponding to the published paper, and a 2017 update. In the 2017 update, both our methods find an 89% completion rate for roads, overall, planet-wide. Within each, three separate components are provided:
- a compiled country-level dataset
- the visual assessment data
- the OpenStreetMap history, aggregated by density, national and sub-national boundaries.
A 167 MB zip file containing all of the above (published analysis version) is at
and a 0.7MB file containing just the first two components, above (published analysis version) is at
Note that the raw history file from OpenStreetMap is available online at https://planet.openstreetmap.org/planet/full-history
Compiled country-level data
The compiled country-level dataset is provided as a .tsv file and a Pandas dataframe:
- countries_compiled.pandas
- countries_compiled.tsv
This dataset will be the most relevant for most users. It compiles all the estimates from the visual assessment and parametric fits, along with country-level data from the World Bank and other sources.
There is one row for each country, identified by ISOalpha3 (ISO alpha3 country code) plus one row for the entire world (ISOalpha3=’ALL’).
The fields/columns are defined in country_datadictionary.tsv. See the paper for complete details. The broad categories of data included are:
- Visual assessment data. These measures can be recreated from the observation-level data in visual_assessment.tsv (described below)
- Data from the OSM history database (these are the actual, not modeled, lengths)
- Parametric fits data
- Combined data from the parametric fits and visual assessment
- Worldwide Governance Indicators (secondary data, provided for convenience)
- Other country-level data (secondary data, provided for convenience)
- IRF World Roads data (secondary data, provided for convenience)
Visual assessment
The observation-level dataset from the visual assessment is provided as a .tsv file and a Pandas dataframe.
- visual_assessment.pandas
- visual_assessment.tsv
Each row corresponds to one observation. See Section 3.1 of the paper for a full discussion.
The data structure is described in the README file included in each zip archive.
Aggregated history
The aggregated history is provided as .hd5 files, which can be loaded using the read_hd5 functions in Pandas. There are 6 different files:
- osmHistory_level-1D.hd5:
- global resolution
- osmHistory_level-0.hd5:
- country-level resolution
- osmHistory_level-1.hd5:
- sub-national resolution, based on the GADM boundaries (see below)
In each case, the _density suffix also disaggregates by population density
The data are in long form, with each row representing the number and length of OSM ways on a given date, and (where applicable) intersecting a given geography in a given density range.
The data structure is described in the README file included in each zip archive.
The geographic boundaries are v2.8 of Global Administrative Area dataset (http://www.gadm.org). Note that ways are double counted where they intersect more than one geography.
Our code |
2017 update |
You can see the country-level table of estimated values corresponding to Section C of the SI for our paper but for the 2017 updated analysis.
Graphical results
A set of graphics corresponding to the published paper's figures (main article and SI) are here:- Several PDF figures
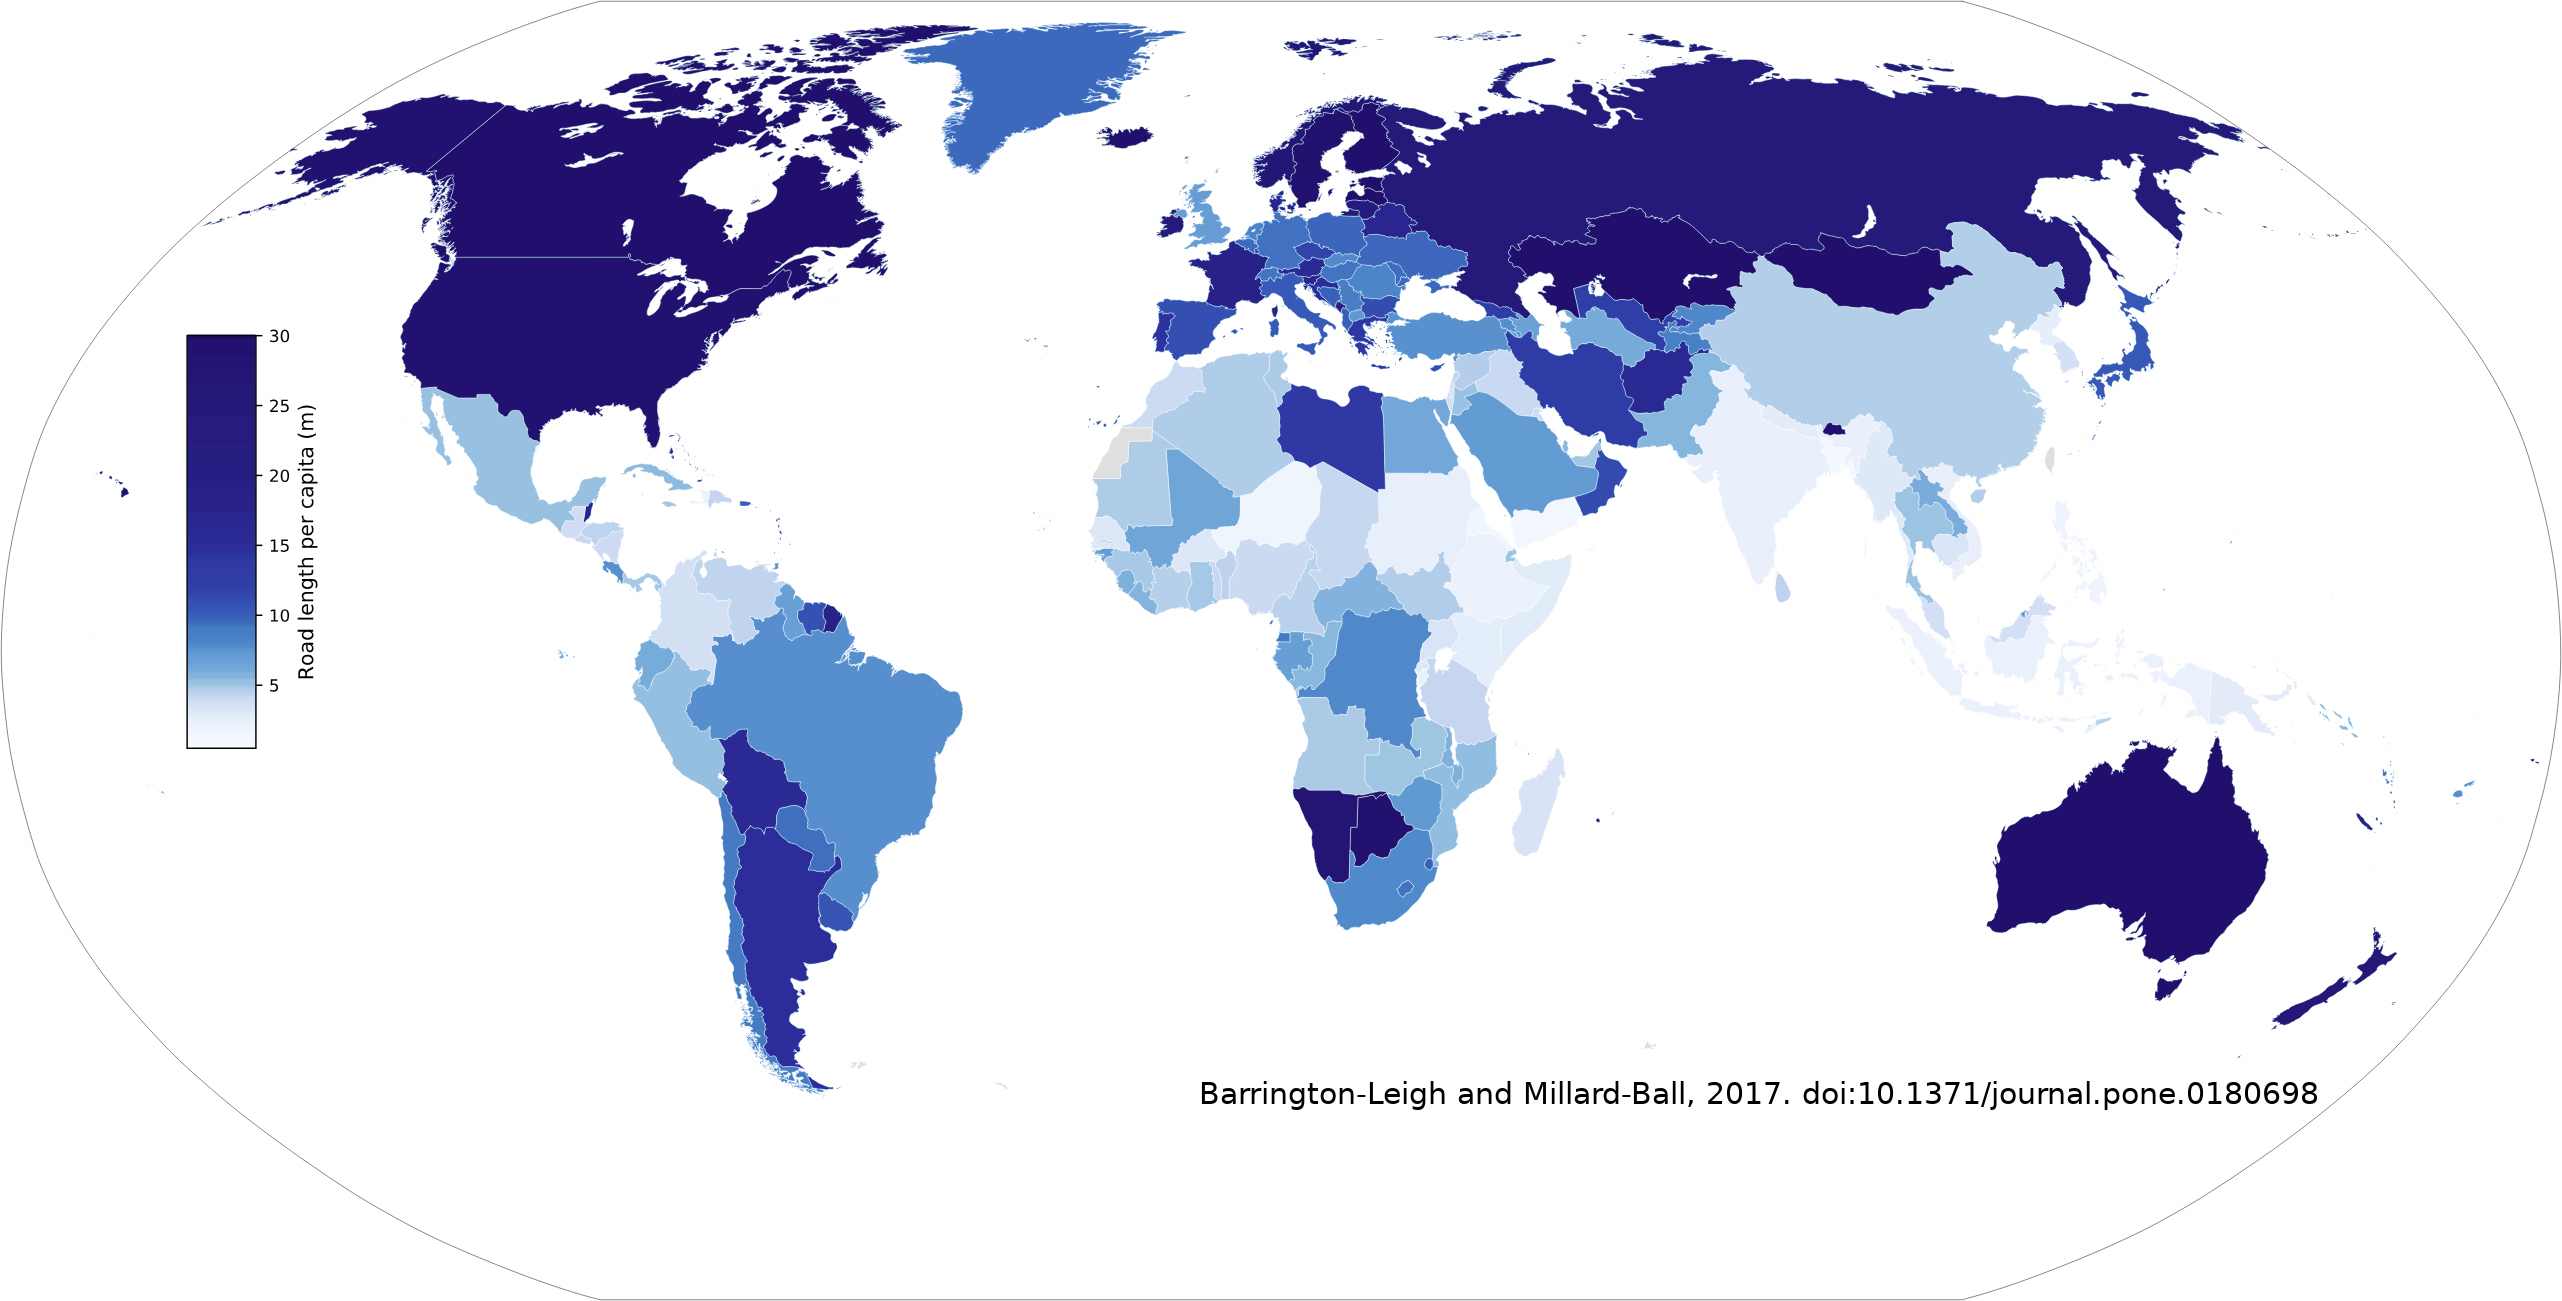
- An SVG map of road length per capita [1.6 MB] (PNG version)
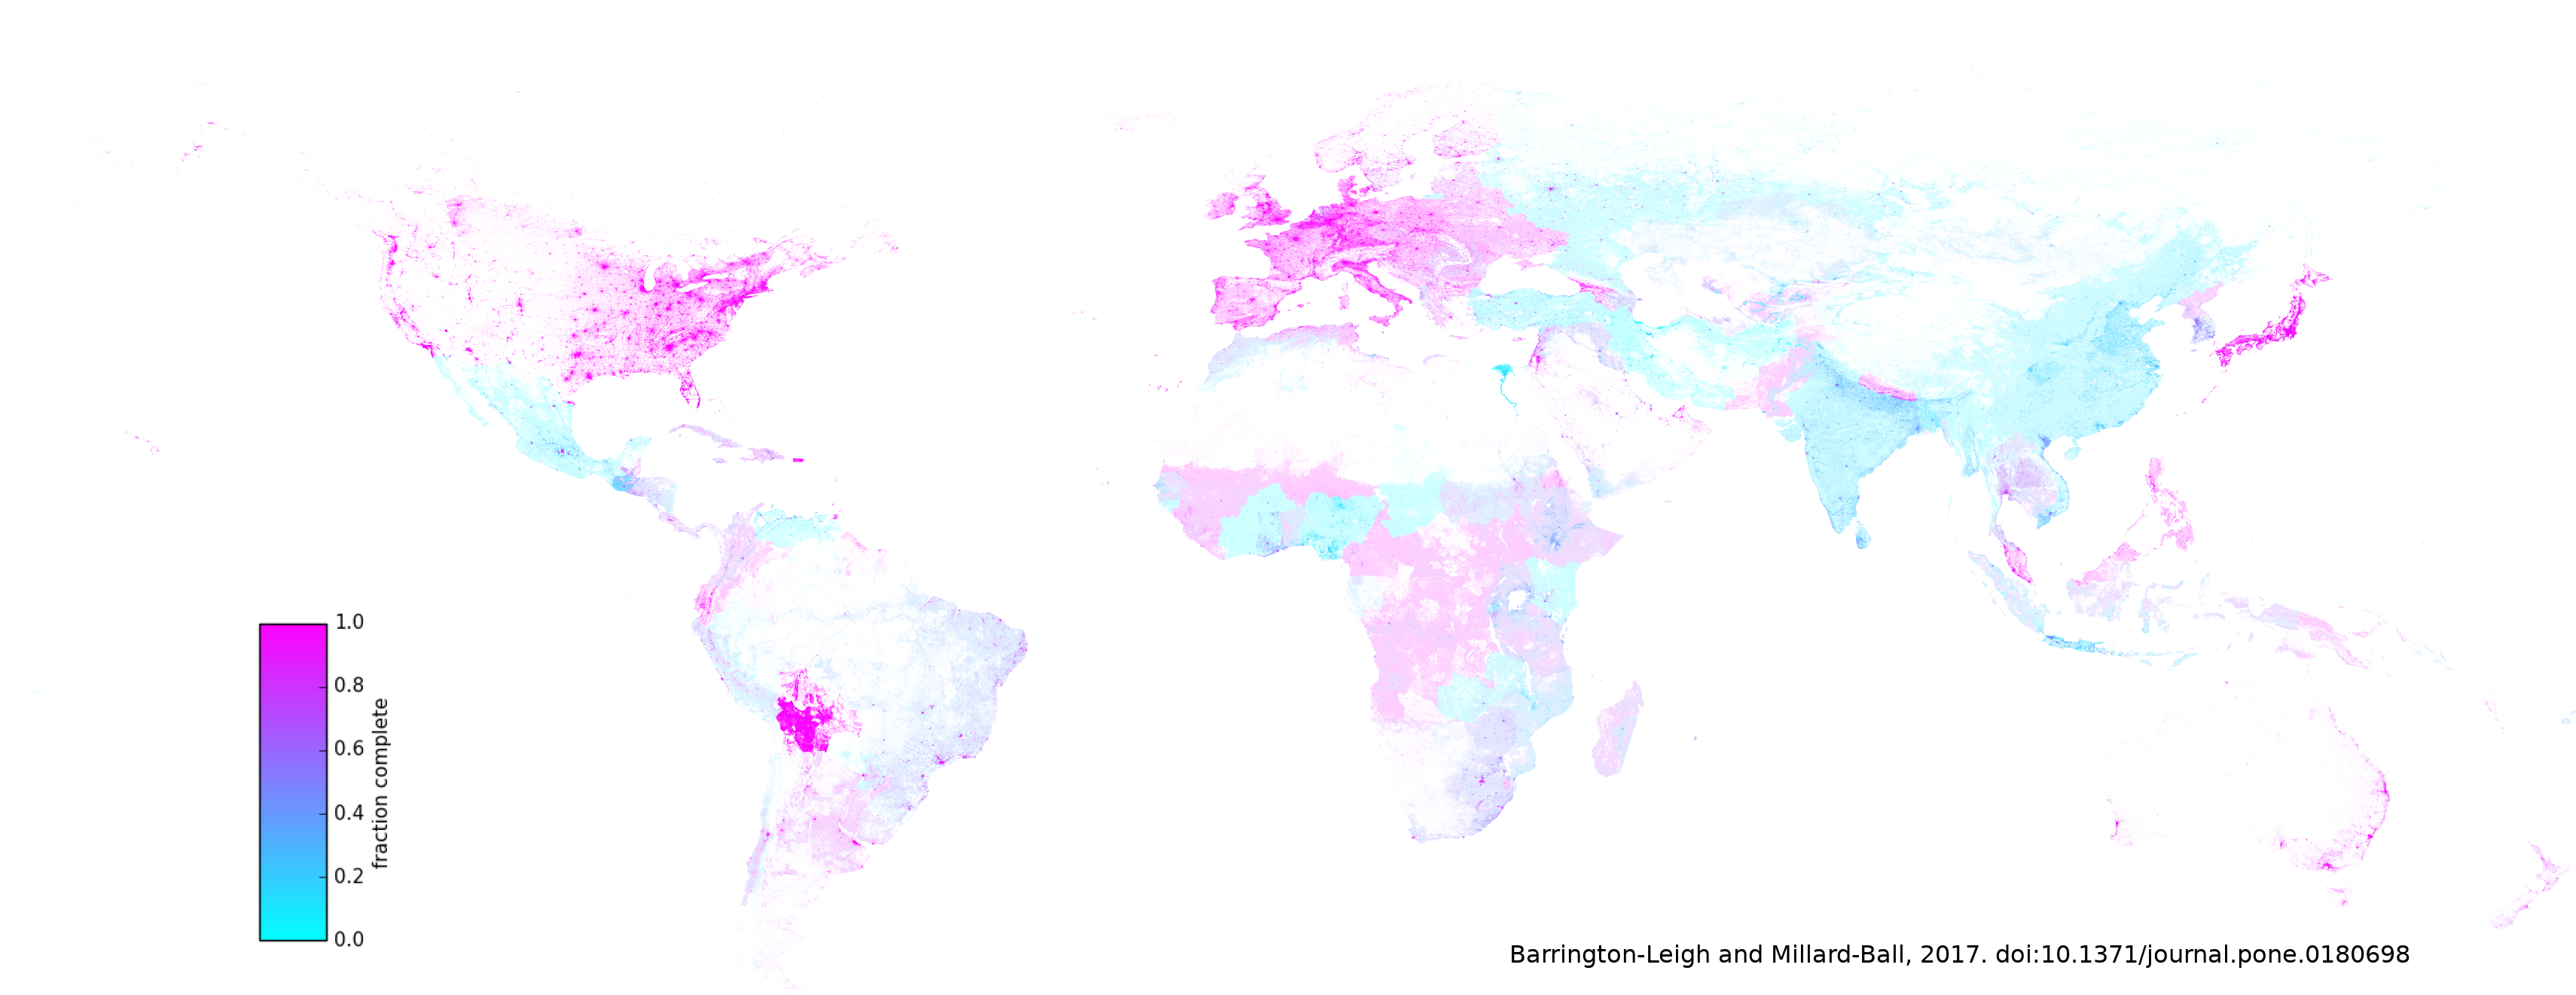
- An SVG map of completeness [1.6 MB]
- The "full resolution" version of Figure 6, PNG map of completeness by grid cell [118MB]; a "high resolution" version of Figure 6, PNG map of completeness by grid cell [1.6MB]
Data release
Here we provide the corresponding data files for this update:A 200 MB zip file containing all of the updated files is at
and a small file containing just the updated compiled country-level dataset is at
Citation |
For any use of data or code, cite the original PLOS One paper.
Contact |
For further questions, please contact either of the (equal) authors:
- Chris Barrington-Leigh, McGill University:


 .
.
- Adam Millard-Ball, University of California, Santa Cruz: adammb@ucsc.edu